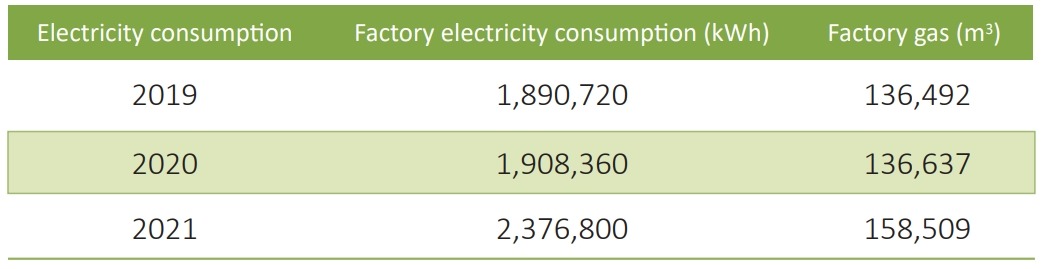
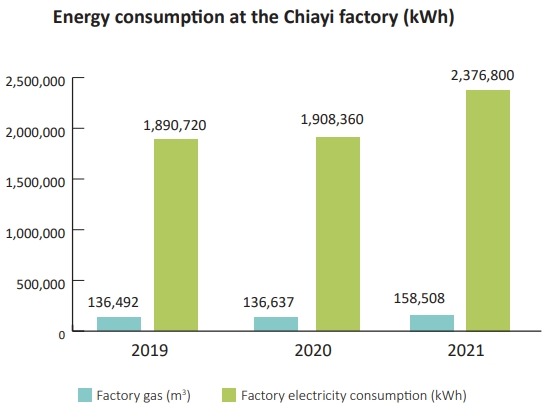
In terms of energy resource management and GHG audit, considering the environmental aspect and the main source of carbon emissions is the Chiayi factory, the reporting boundary of the carbon emissions statistics is the Chiayi factory. According to calculations by the Finance Center, current energy consumption by the Chiayi factory accounts for 6.5% of its total operating cost. The table below illustrates the gas and electricity consumption of the factory from 2019 to 2021, and the reason for the higher electricity consumption in 2021 is elaborated below:
1. In 2019 and 2020, since very little change was made to the equipment, variations in gas and electricity consumption were negligible. As the P2 factory expansion was completed in 2021 and commenced trial production, overall energy consumption showed a significant increase. When official mass production begins in the future, we will need to continue recording and observing the energy consumption conditions.
2. Currently, the electricity monitoring approach is adopted, where electricity meters are installed in various regions to monitor their respective electricity consumptions. Besides checking for abnormal electricity consumption in the factory, we can focus on power-hungry equipment to discuss and come up with improvement solutions.
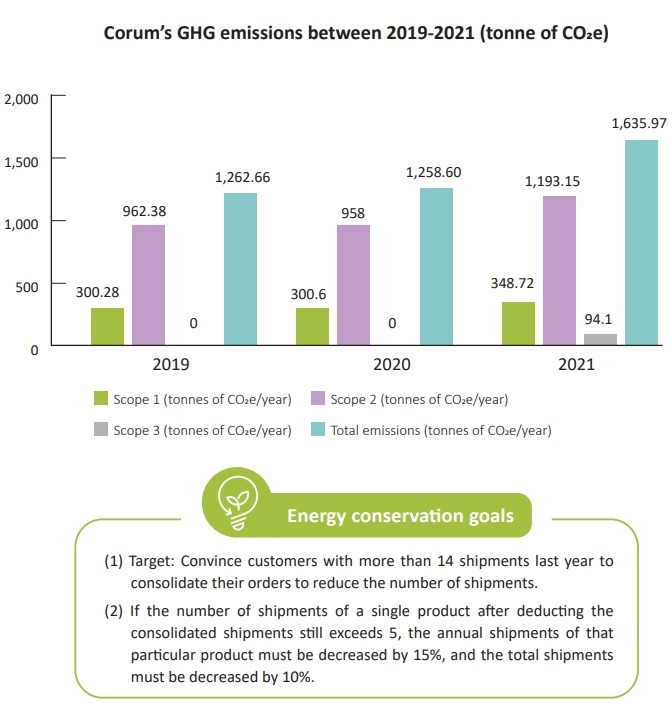
3. The GHG audit focuses on scope 1 (direct emissions, gas is the main source of emissions at the Chiayi factory), scope 2 (indirect emissions, purchased electricity is the main source of emissions at the Chiayi factory), scope 3 (other emissions consisting of transport emissions by employees commuting to work).
The total GHG emissions in 2021 were 1,635.97 tonnes of CO2e. Carbon emissions calculation is based on ISO 14064-1.

Note: Scope 3 audit was implemented in 2021 on carbon emissions generated by our employees commuting to work. The calculation is based on a census of our internal employees' mode of commuting combined with the annual average working days and transport emissions coefficient from the Bureau of Energy, MOEA, and the Industrial Technology Research (ITRI). Please refer to the notes for further details.
Note 1: Based on the Bureau of Energy, MOEA's electricity emissions coefficient in 2021 (0.502 kg CO2e/kWh) and gas emissions coefficient (2.2 kg CO2e/m?).
Note 2: The higher GHG emissions in 2021 compared to 2020 were due to an increase in production capacity.
Note 3: Referring to ITRI's Carbon Footprint Information Platform, gasoline passenger cars emit 0.115kg of CO2e/km while motorcycles emit 0.0951kg of CO2e/km.
Note 4: Calculated based on cars with an engine displacement of 2,000cc, consuming 0.0714 liters of fuel per kilometer. Calculated based on motorcycles with an engine displacement of 150cc, consuming 0.0223 liters of fuel per kilometer.
Note 5: Refer to the Bureau of Energy, MOEA's website, 1 liter of gasoline=7,800kcal, 1kcal=4.184J.
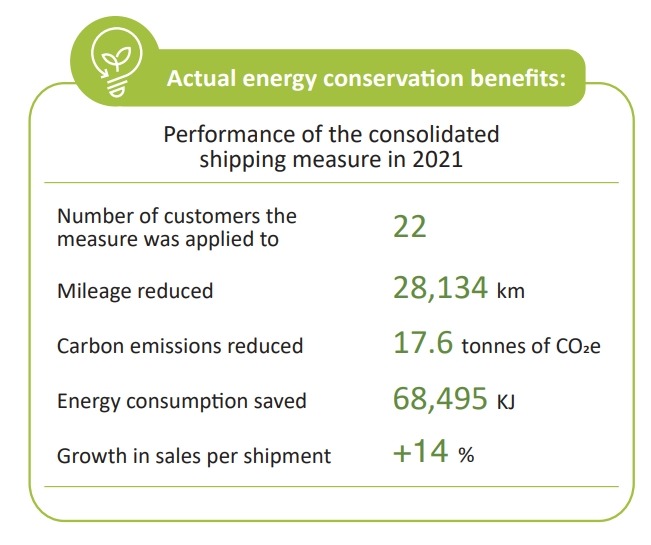
Note 1: The mileage is calculated by multiplying the hypothetical shipping distances of the regions with the highest number of shipments in December 2021 in the north, central, and south regions by the number of shipments in various regions and totaled.
Note 2: Gasoline commercial trucks emit 0.626kg of CO2e/km.
Note 3: Calculated based on small trucks with an engine displacement of 1.5L, consuming 0.0746 liters of fuel per kilometer.
Note 3: Calculated based on small trucks with an engine displacement of 1.5L, consuming 0.0746 liters of fuel per kilometer.
Above energy conservation calculations are conducted based on ITRI's Carbon Footprint Information Platform and Bureau of Energy, MOEA
Corum perceives great importance in water quality inspection and waste/sewage water discharge management. The water withdrawal of our offices and factories complies with legal regulations and standards, exerting no significant ecological impact on water sources. The Chiayi factory is situated by the Niuchou River in Minxiong Township, Chiayi County, and our effluent sample is tested by qualified environmental testing agencies regularly. The test results meet the EPA, Executive Yuan's effluent discharge standards. There was no violation of laws and regulations on water quality and discharge requirements in 2021.
The Chiayi factory's wastewater is recovered in the form of condensate water: Soft water generated by the water softener is supplied to the boiler via the water tank, where the steam from the boiler is supplied to the reaction equipment or heat exchanger before it is condensed into condensate water and returned to the water tank for reuse.

In terms of energy resource management and GHG audit, considering the environmental aspect and the main source of carbon emissions is the Chiayi factory, the reporting boundary of the carbon emissions statistics is the Chiayi factory. According to calculations by the Finance Center, current energy consumption by the Chiayi factory accounts for 6.5% of its total operating cost. The table below illustrates the gas and electricity consumption of the factory from 2019 to 2021, and the reason for the higher electricity consumption in 2021 is elaborated below:
1. In 2019 and 2020, since very little change was made to the equipment, variations in gas and electricity consumption were negligible. As the P2 factory expansion was completed in 2021 and commenced trial production, overall energy consumption showed a significant increase. When official mass production begins in the future, we will need to continue recording and observing the energy consumption conditions.
2. Currently, the electricity monitoring approach is adopted, where electricity meters are installed in various regions to monitor their respective electricity consumptions. Besides checking for abnormal electricity consumption in the factory, we can focus on power-hungry equipment to discuss and come up with improvement solutions.
3. The GHG audit focuses on scope 1 (direct emissions, gas is the main source of emissions at the Chiayi factory), scope 2 (indirect emissions, purchased electricity is the main source of emissions at the Chiayi factory), scope 3 (other emissions consisting of transport emissions by employees commuting to work).
The total GHG emissions in 2021 were 1,635.97 tonnes of CO2e. Carbon emissions calculation is based on ISO 14064-1.
Note: Scope 3 audit was implemented in 2021 on carbon emissions generated by our employees commuting to work. The calculation is based on a census of our internal employees' mode of commuting combined with the annual average working days and transport emissions coefficient from the Bureau of Energy, MOEA, and the Industrial Technology Research (ITRI). Please refer to the notes for further details.
Note 1: Based on the Bureau of Energy, MOEA's electricity emissions coefficient in 2021 (0.502 kg CO2e/kWh) and gas emissions coefficient (2.2 kg CO2e/m?).
Note 2: The higher GHG emissions in 2021 compared to 2020 were due to an increase in production capacity.
Note 3: Referring to ITRI's Carbon Footprint Information Platform, gasoline passenger cars emit 0.115kg of CO2e/km while motorcycles emit 0.0951kg of CO2e/km.
Note 4: Calculated based on cars with an engine displacement of 2,000cc, consuming 0.0714 liters of fuel per kilometer. Calculated based on motorcycles with an engine displacement of 150cc, consuming 0.0223 liters of fuel per kilometer.
Note 5: Refer to the Bureau of Energy, MOEA's website, 1 liter of gasoline=7,800kcal, 1kcal=4.184J.
Note 1: The mileage is calculated by multiplying the hypothetical shipping distances of the regions with the highest number of shipments in December 2021 in the north, central, and south regions by the number of shipments in various regions and totaled.
Note 2: Gasoline commercial trucks emit 0.626kg of CO2e/km.
Note 3: Calculated based on small trucks with an engine displacement of 1.5L, consuming 0.0746 liters of fuel per kilometer.
Note 3: Calculated based on small trucks with an engine displacement of 1.5L, consuming 0.0746 liters of fuel per kilometer.
Above energy conservation calculations are conducted based on ITRI's Carbon Footprint Information Platform and Bureau of Energy, MOEA
Corum perceives great importance in water quality inspection and waste/sewage water discharge management. The water withdrawal of our offices and factories complies with legal regulations and standards, exerting no significant ecological impact on water sources. The Chiayi factory is situated by the Niuchou River in Minxiong Township, Chiayi County, and our effluent sample is tested by qualified environmental testing agencies regularly. The test results meet the EPA, Executive Yuan's effluent discharge standards. There was no violation of laws and regulations on water quality and discharge requirements in 2021.
The Chiayi factory's wastewater is recovered in the form of condensate water: Soft water generated by the water softener is supplied to the boiler via the water tank, where the steam from the boiler is supplied to the reaction equipment or heat exchanger before it is condensed into condensate water and returned to the water tank for reuse.